


What is Statistics and how to use it?
Last Updated: May 7, 2026
Bodygraph Statistics are designed to help subscribers monitor how their Human Design and Astrology integrations are performing. This feature provides practical insights into engagement and conversion trends, allowing you to evaluate what is working and where improvements may be needed.
Statistics are tracked on a rolling 90-day basis and include:
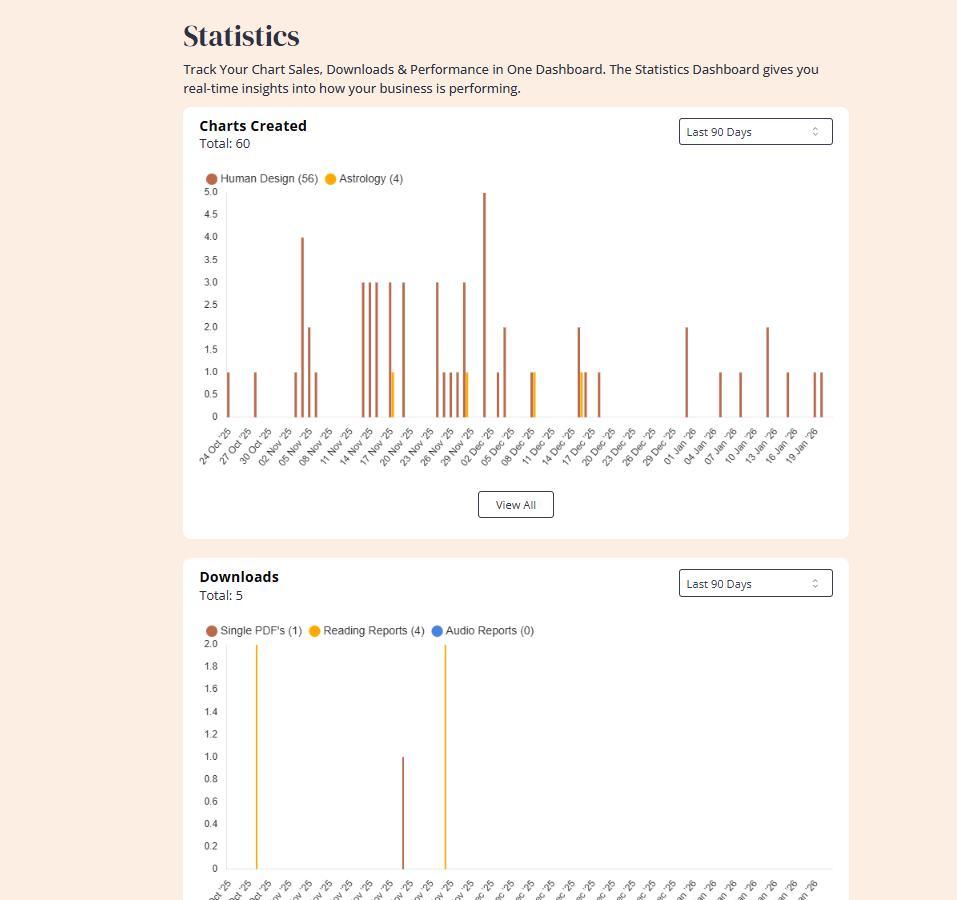
Chart generations created via chart embeds
PDF and audio report downloads
Report sales activity linked to your integrations
The Statistics feature is intended for performance observation and business optimisation only. Once the 90-day rolling period passes, historical data is automatically removed and cannot be restored. Subscribers are responsible for reviewing, exporting, or recording insights they wish to retain for long-term reference. Best practice is to connect Newsletter or Data Storage app for the data retention.
To check your integration statistics, follow the steps below:
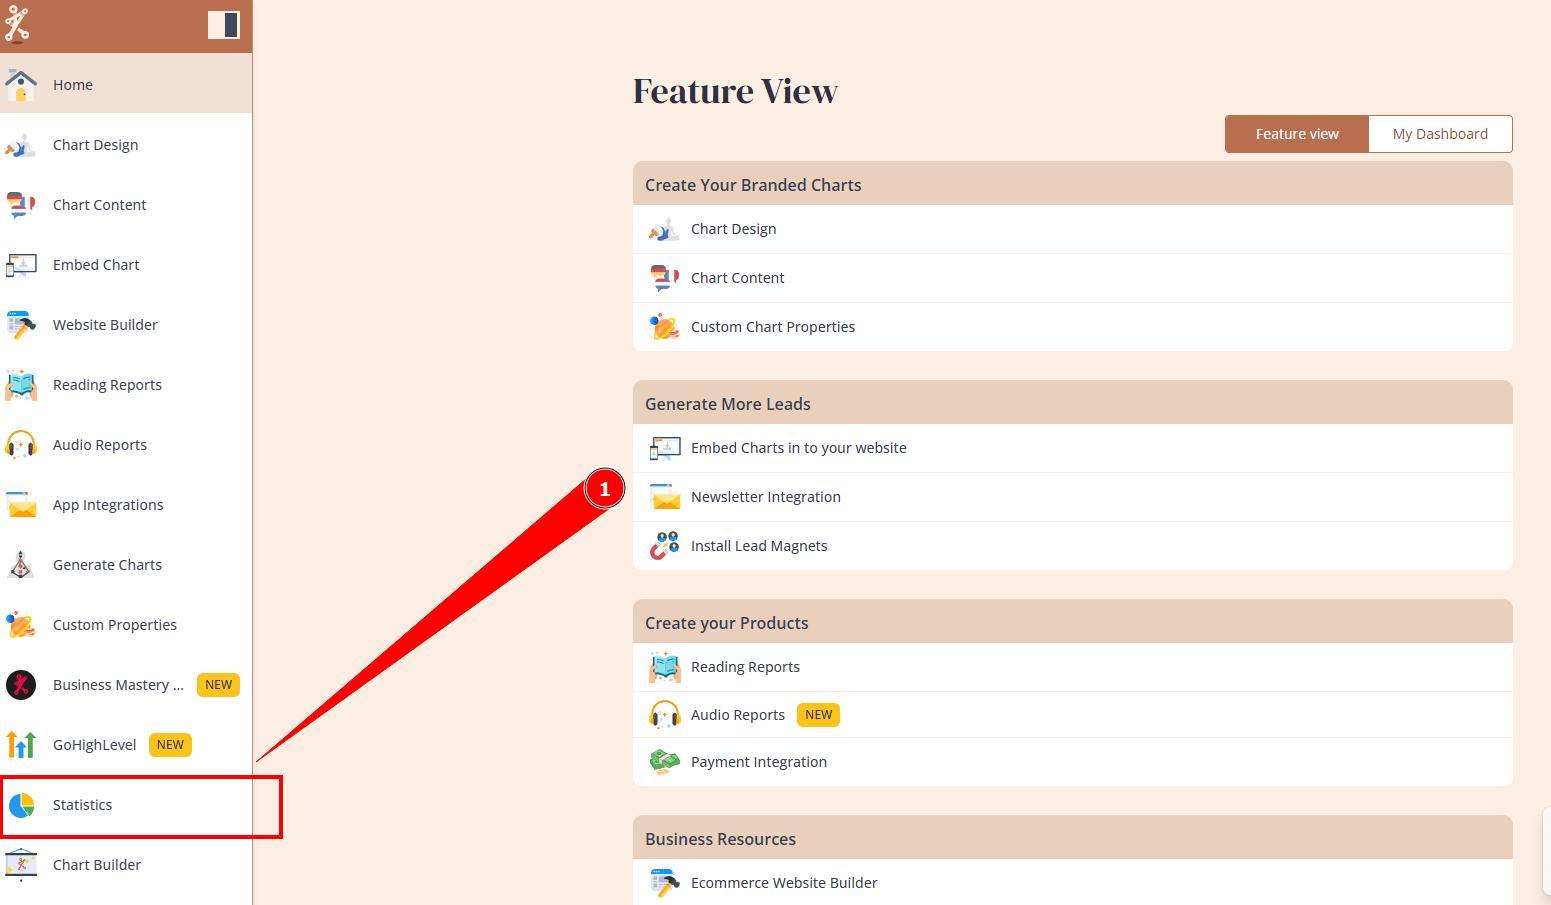
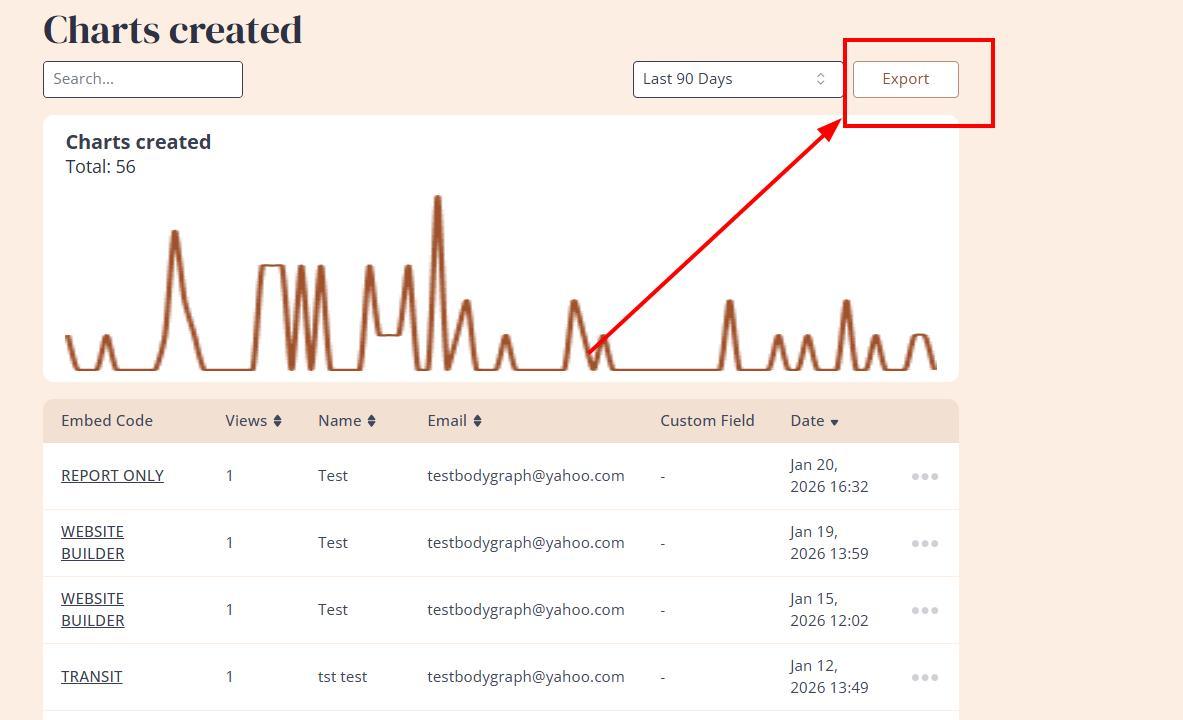
1. Select Statistics at your Bodygraph dashboard.
2. You will be able to see several Statistic charts about integration performance.
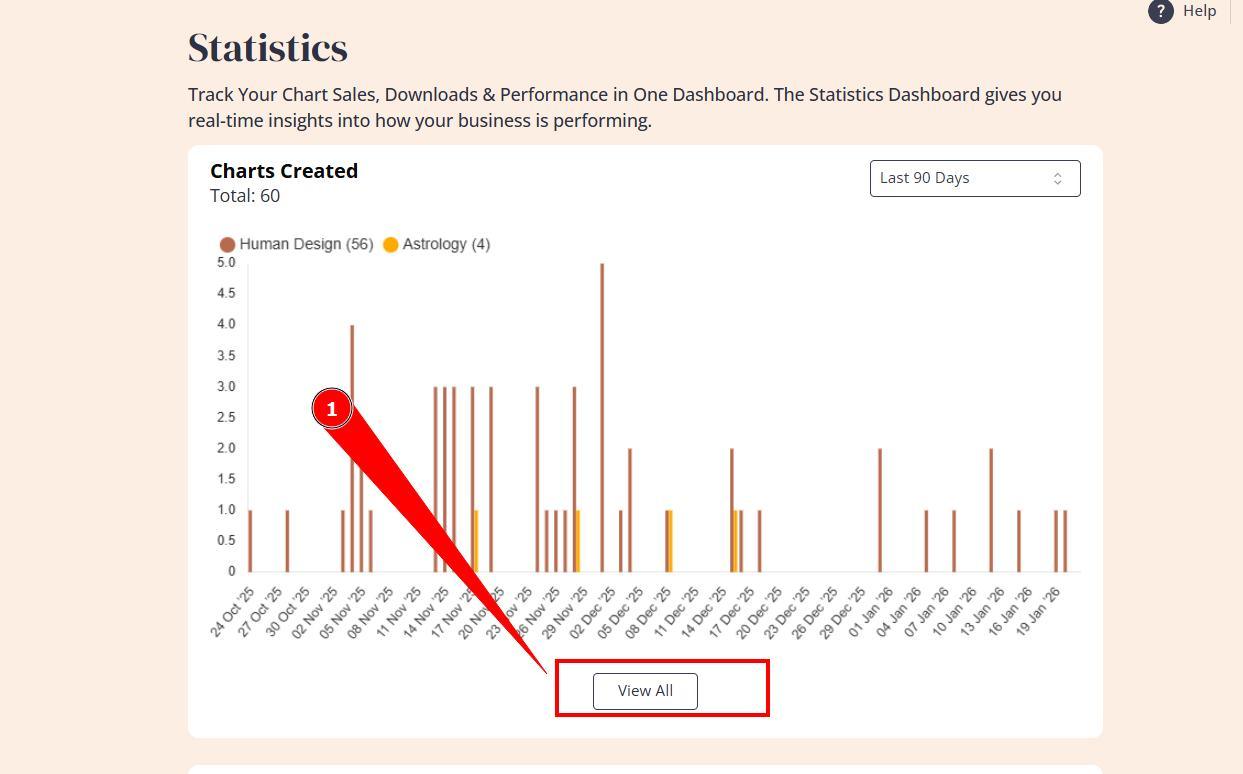
3. You can click View more button next to the statistics that you wish to check.
4. There is an option to choose a timeframe of the statistics for more precise or expanded view. There is no option to go beyond 90 days in Statistics as data is only stored at the server for 90 days and then gets removed.
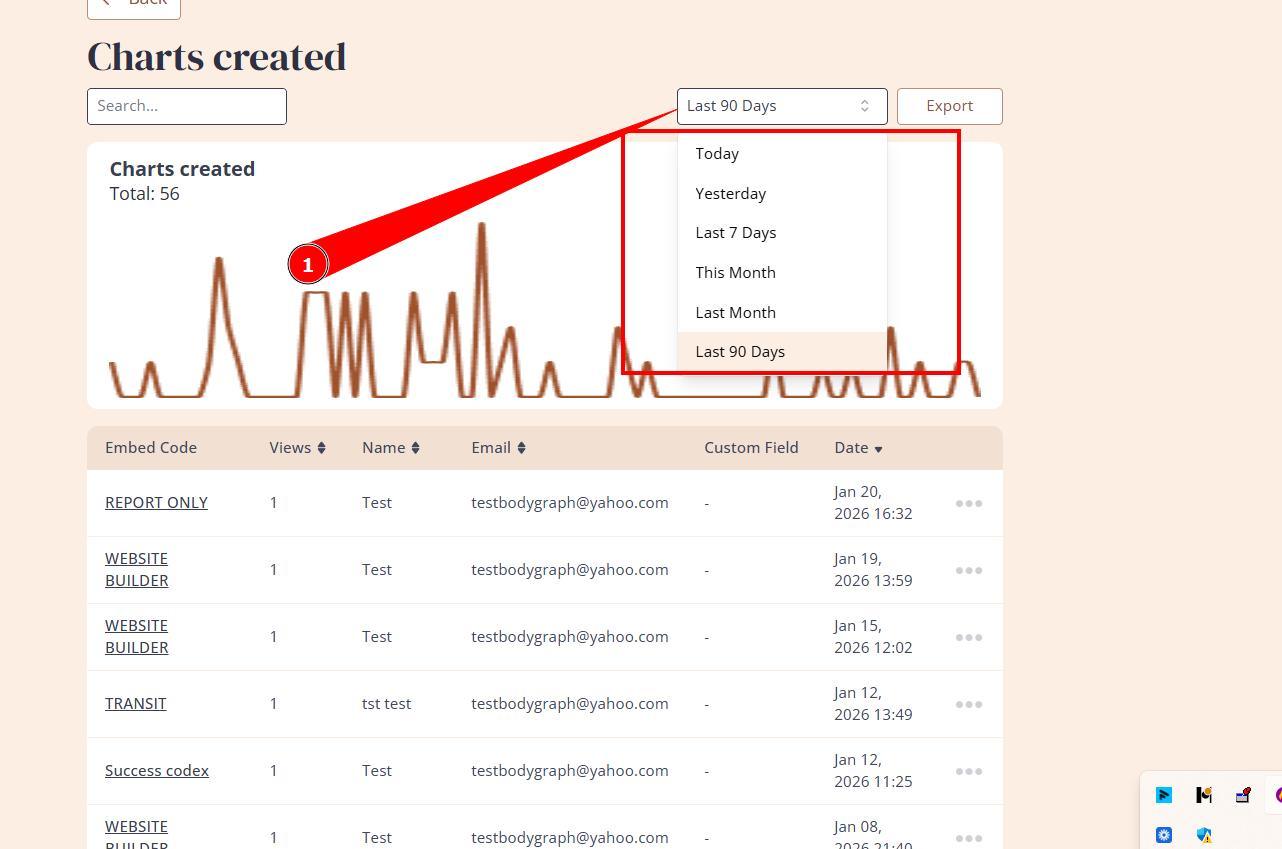
5. There is also opportunity to export CSV file if you wish to export contacts and keep safe copy of them.
Related Video:
Still have questions, is above guide outdated? Please message us on Live Chat or send an email to support@bodygraph.com.
All the Tools You Need to Build, Grow, and Scale Your Human Design and Astrology Business
