


STEP 2: Design your chart
Last Updated: Dec 9, 2025
Designing your first chart is where your creativity meets the practical side of running a Human Design and astrology-based business. Once your branding foundations are in place and you know which tools you will use, the chart design tool becomes the central place to shape how your charts look across integrations, reports, and client-facing experiences.
This guide walks you through the full chart design workflow, explains every key setting, highlights common mistakes, and answers the most frequently asked questions.
Getting Started
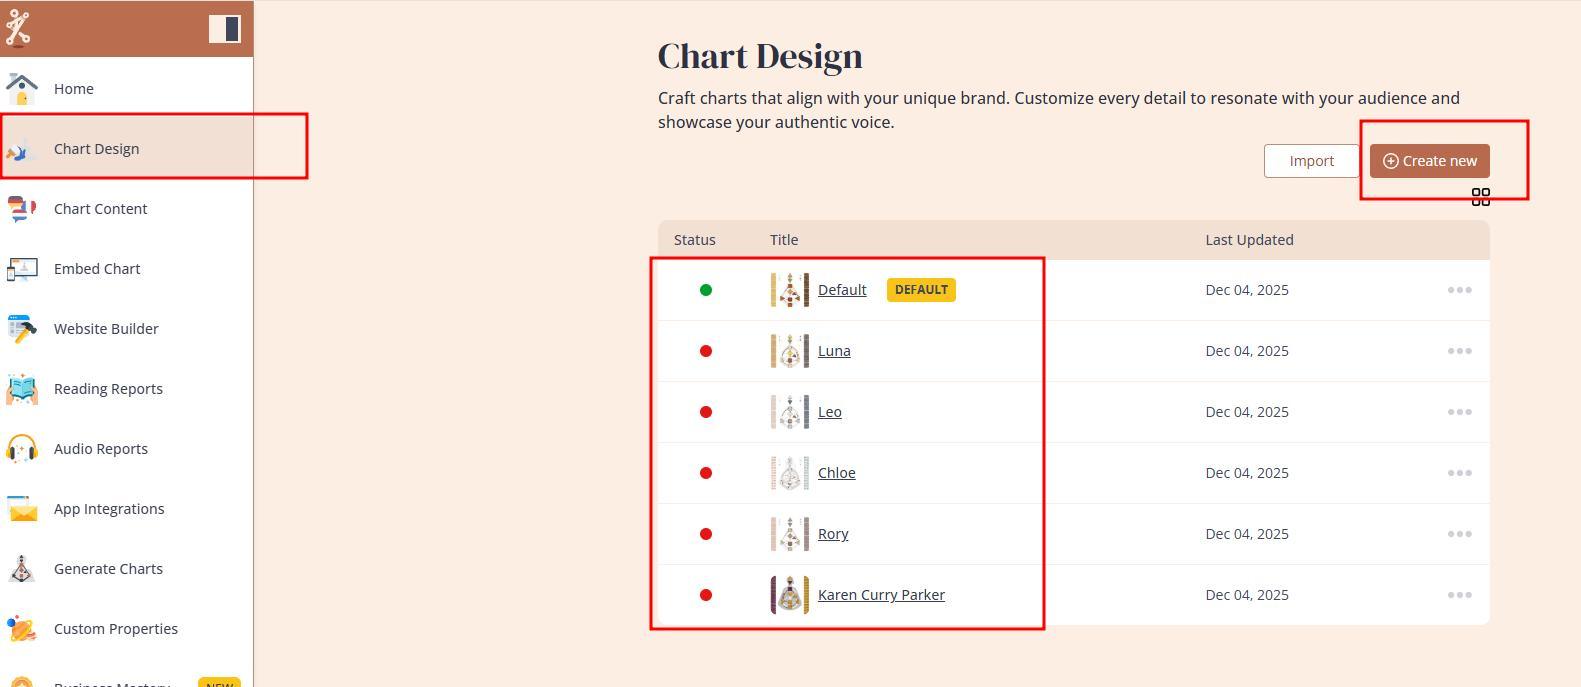
When you start your subscription or free trial, you’ll find a library of pre-made chart designs. You can:
• open and edit an existing design
• create a completely new design from scratch using the Create New button.
What You Can Edit in the Chart Design Tool
The design tool contains several areas of customization. Each affects how your integration looks and behaves.
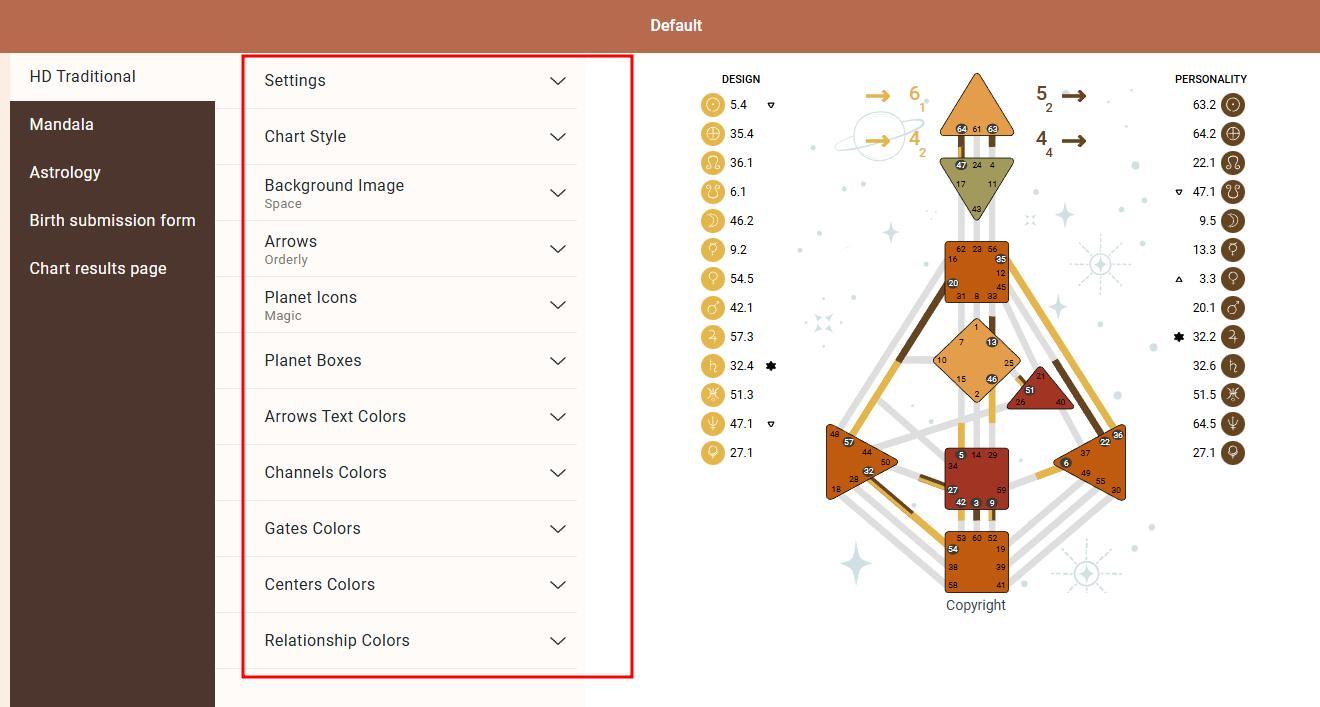
1. Human Design chart colors, styles and backgrounds
• gates
• channels
• centers
• combination designs for relationship charts
• and more
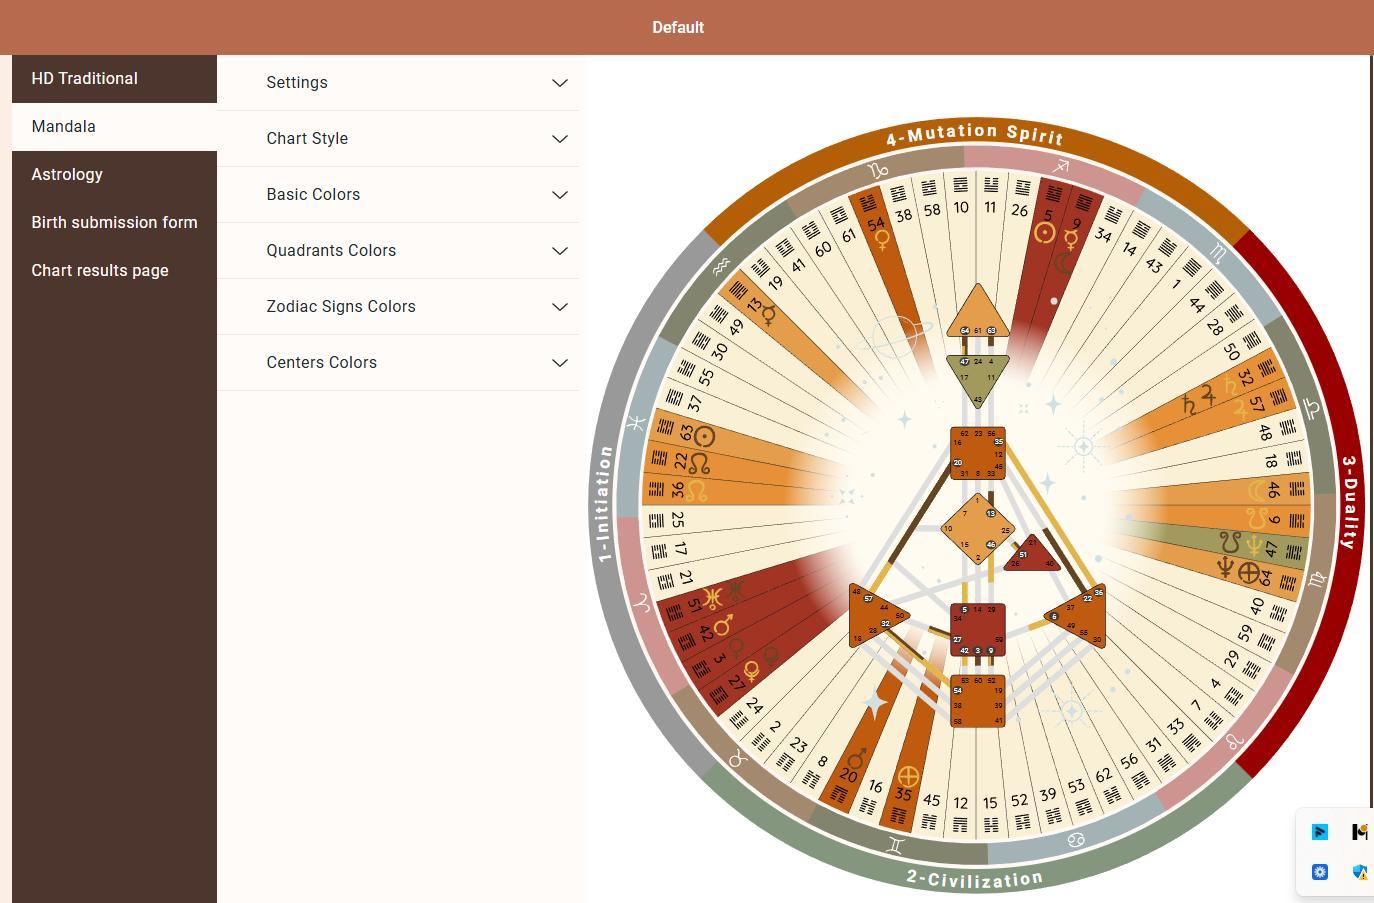
2. Mandala design and settings
• optional element to include in integrations or reports
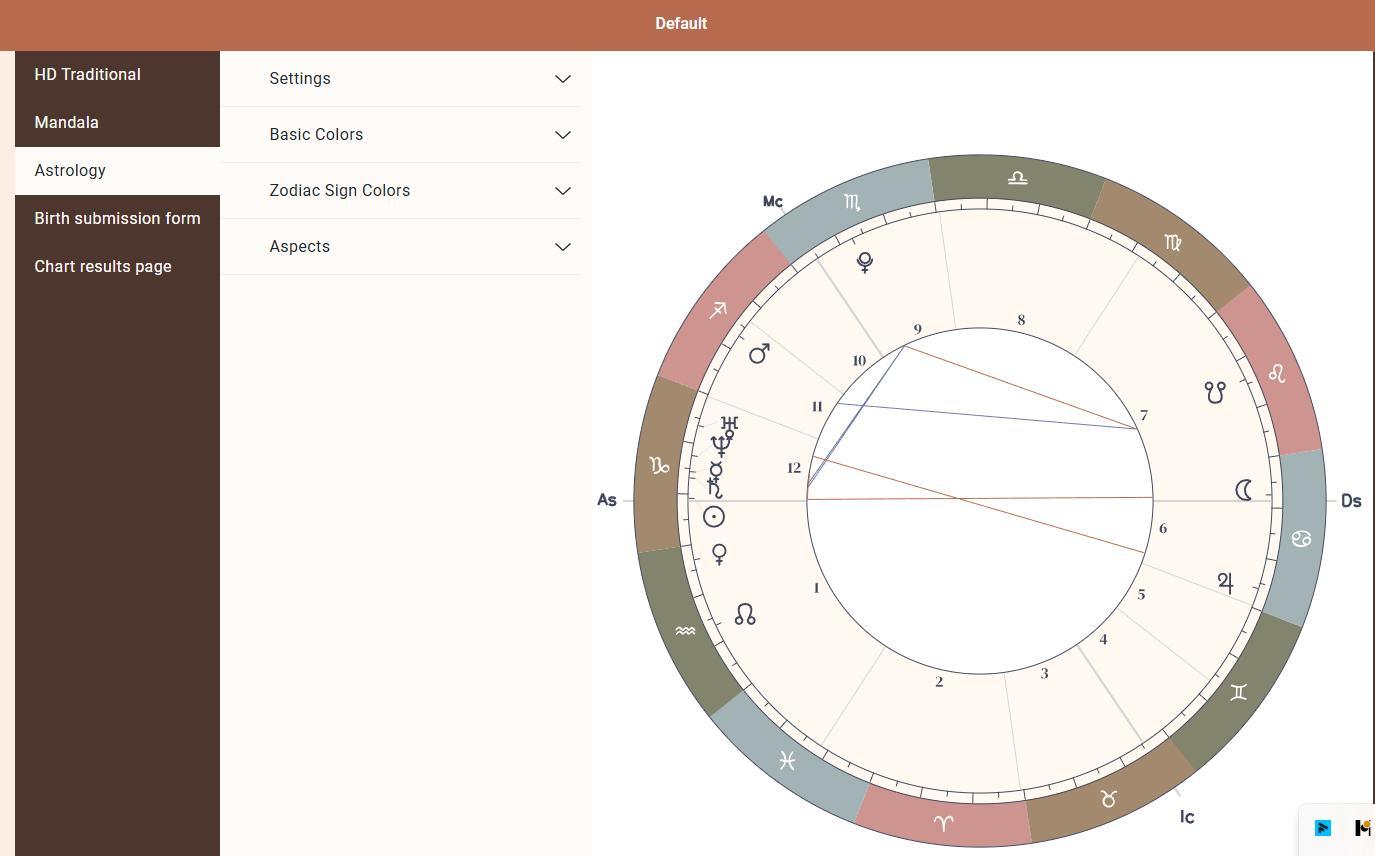
3. Astrology chart design and settings
• customize planetary layout
• select preferred styling
• apply colors that match your brand
• house system – Placidus, Whole Sign, or another system of your choice
• tropical or sidereal charts
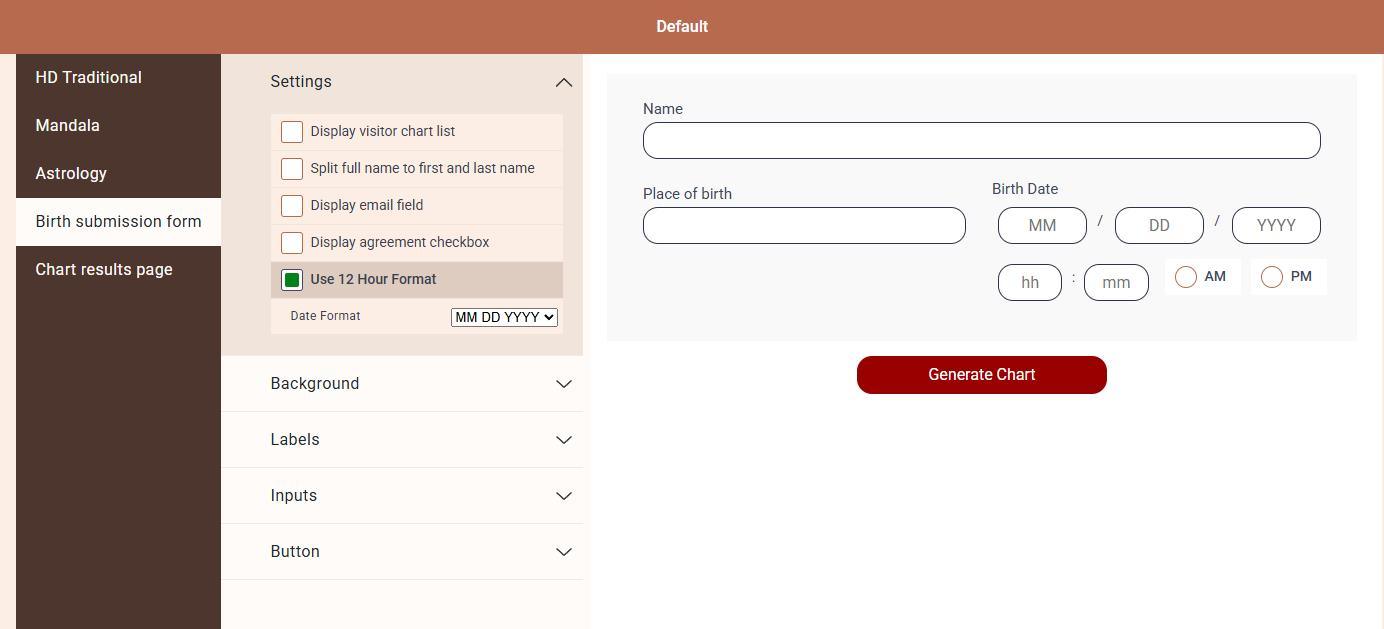
4. Submission form design and settings
All elements of your birth data submission form can be styled, including:
• colors
• fonts
• layout
• button shapes
• time and date formats
• agreement checkboxes
• optional email field
• other settings
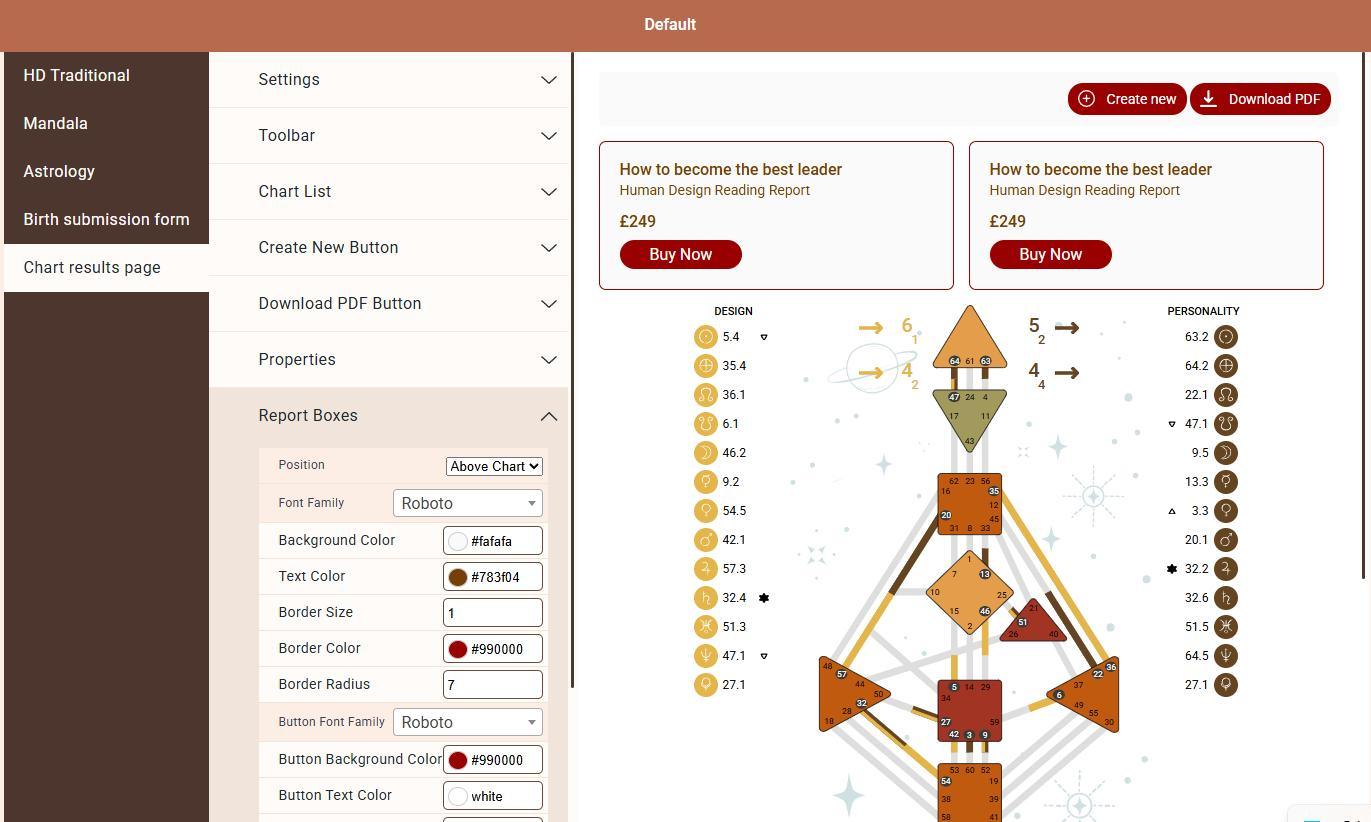
5. Chart result page design and settings
This controls the layout and visual experience the user sees after submitting the form.
Important settings include:
• show or hide PDF download button
• show or hide property descriptions
• show or hide tooltips
• decide whether the report boxes appear above or below the chart
Having report boxes above the chart is generally more effective, as clients see your paid content first rather than the free chart.
Applying Your Design to Your Integration
Navigate to your Embed Chart.
Open the embed code settings.
Select Chart Design.
Choose the design you created or edited.
This tells the integration which design to use. Once embedded on your website, the integration will adopt these settings.
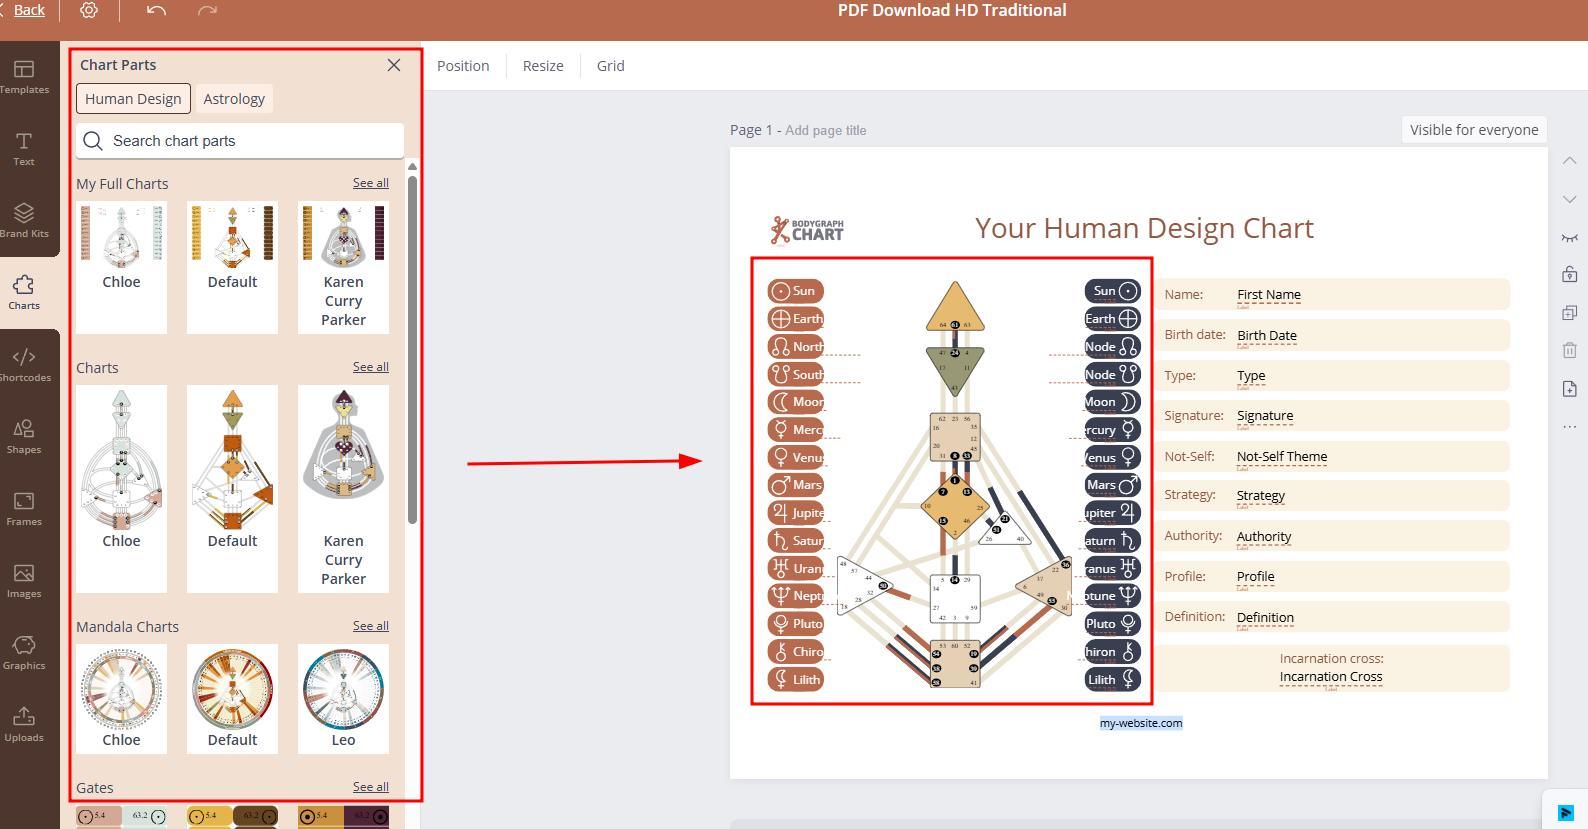
Using the Chart Design in Reading Reports
The design tool also connects to the reports editor. In the report builder:
• open an existing template or create a new report
• select Chart from the left-hand panel
• add the chart as a complete chart or as separate elements
You can position, resize, or combine:
• chart centers
• planets
• variables
• backgrounds
Important to note
Some design styles available in the chart design tool are not supported in reports, especially partial background styles for planets. If your integration uses planet backgrounds only behind icons, reports will not automatically match that style.
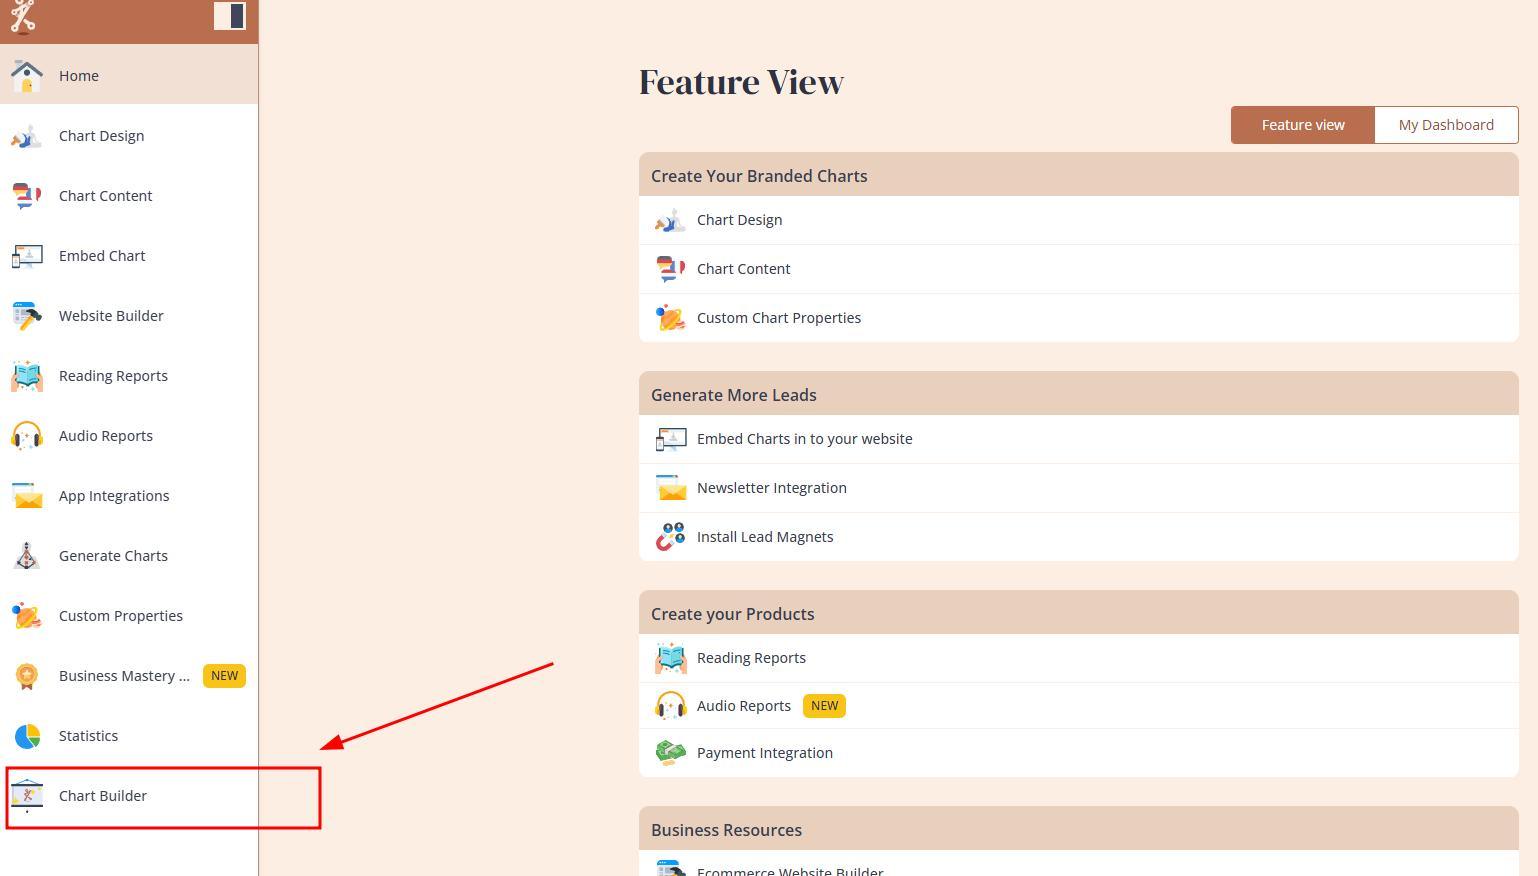
Using Your Design in Generate Chart and Chart Builder Tools
Two additional tools use your chart design:
Generate Chart tool
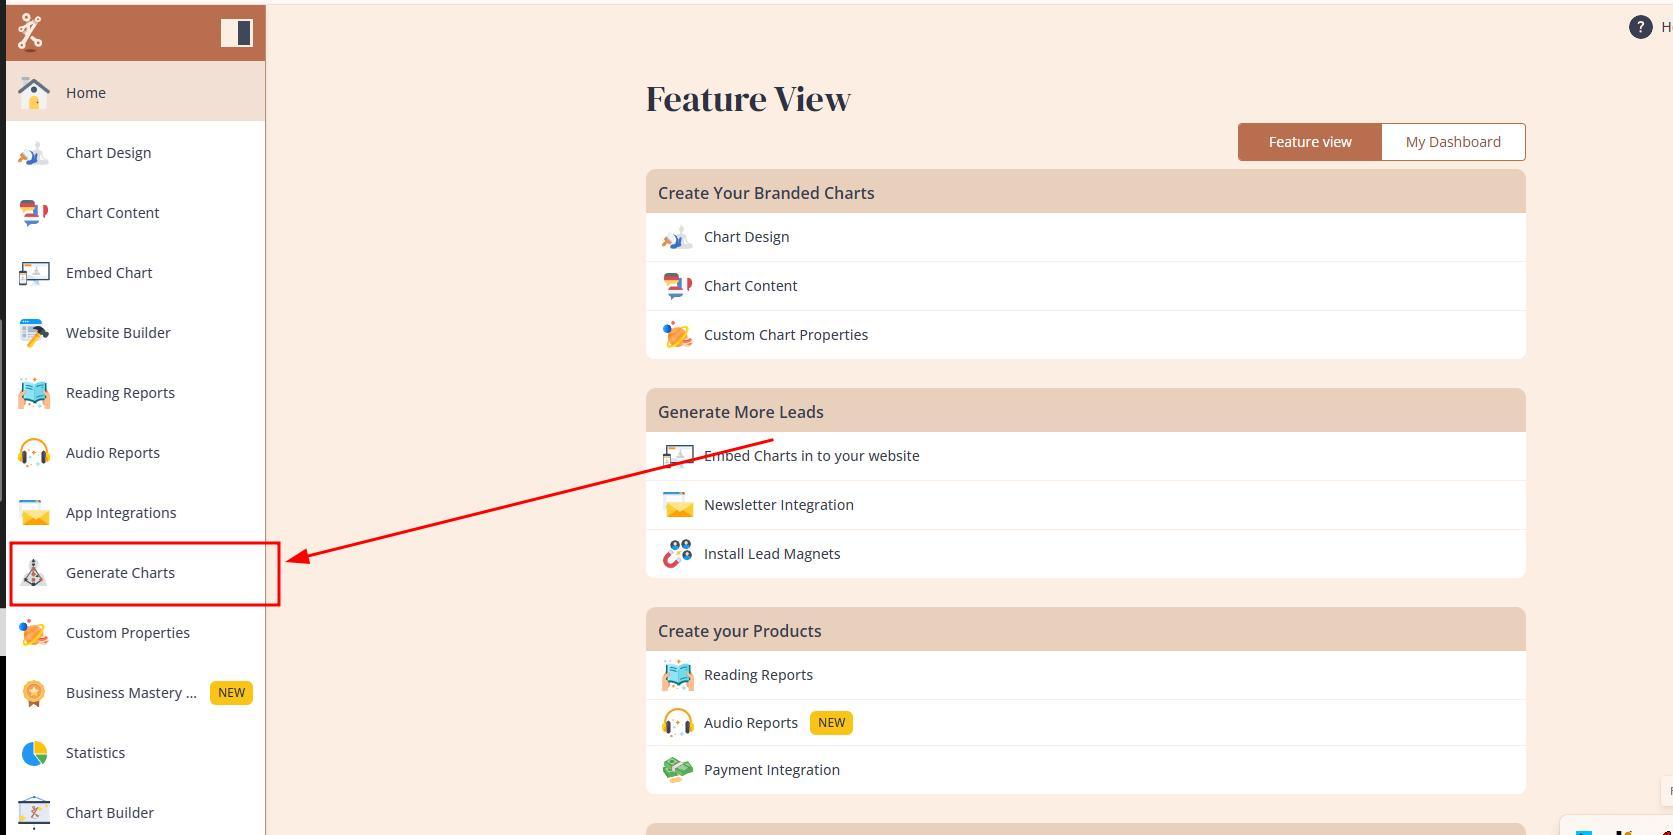
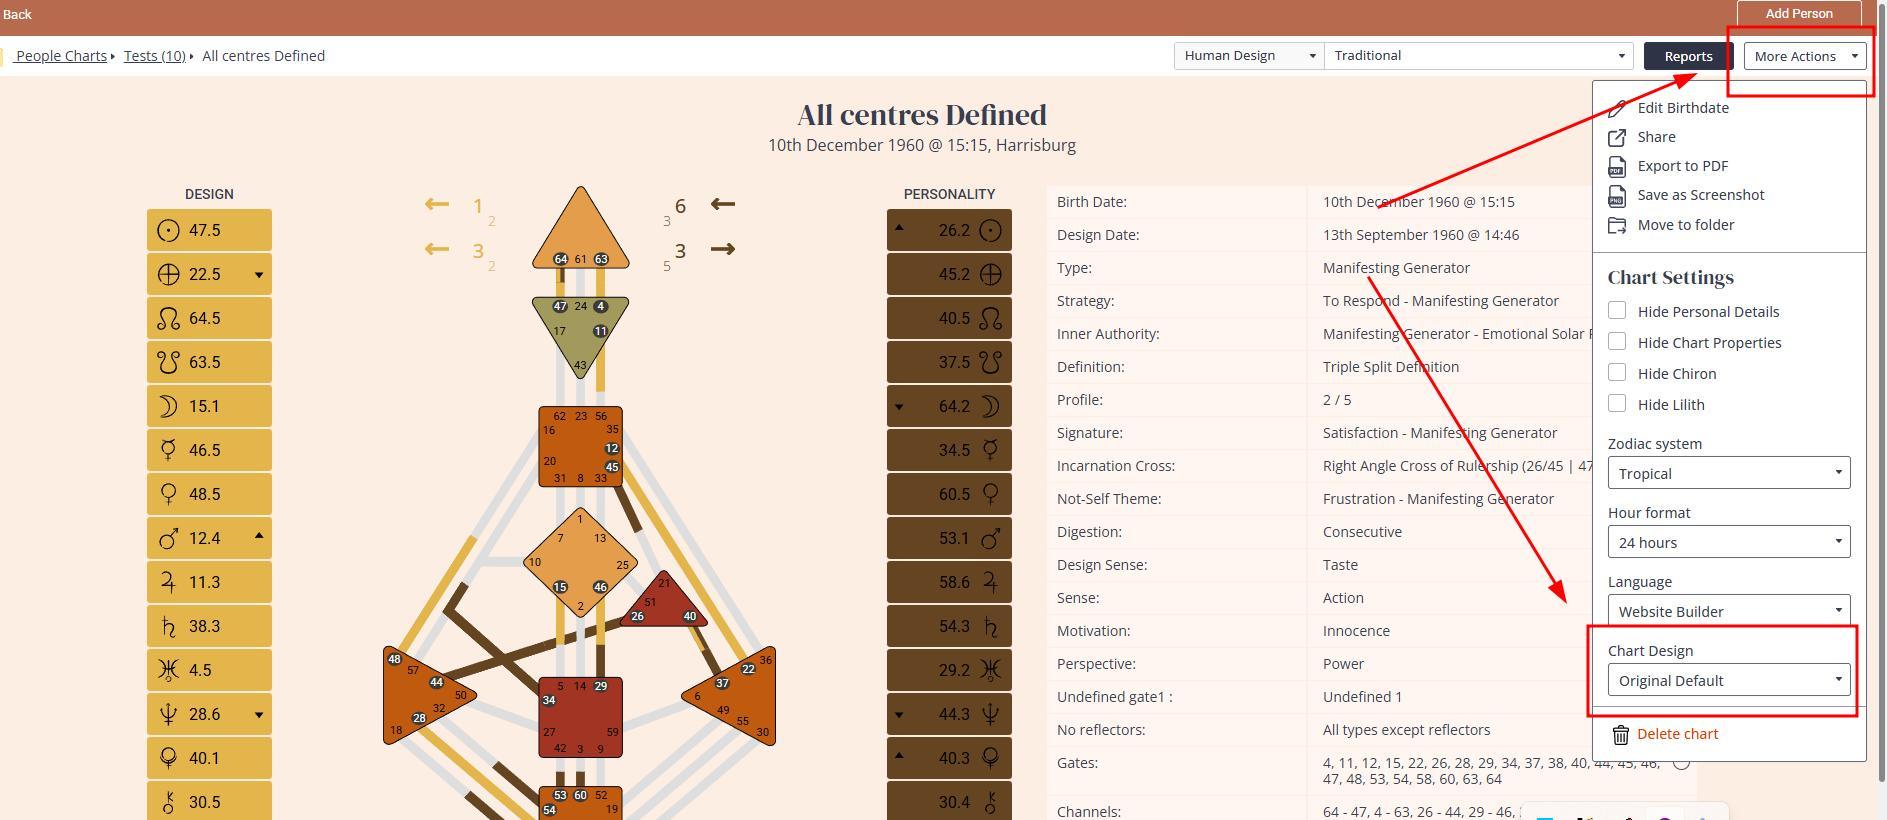
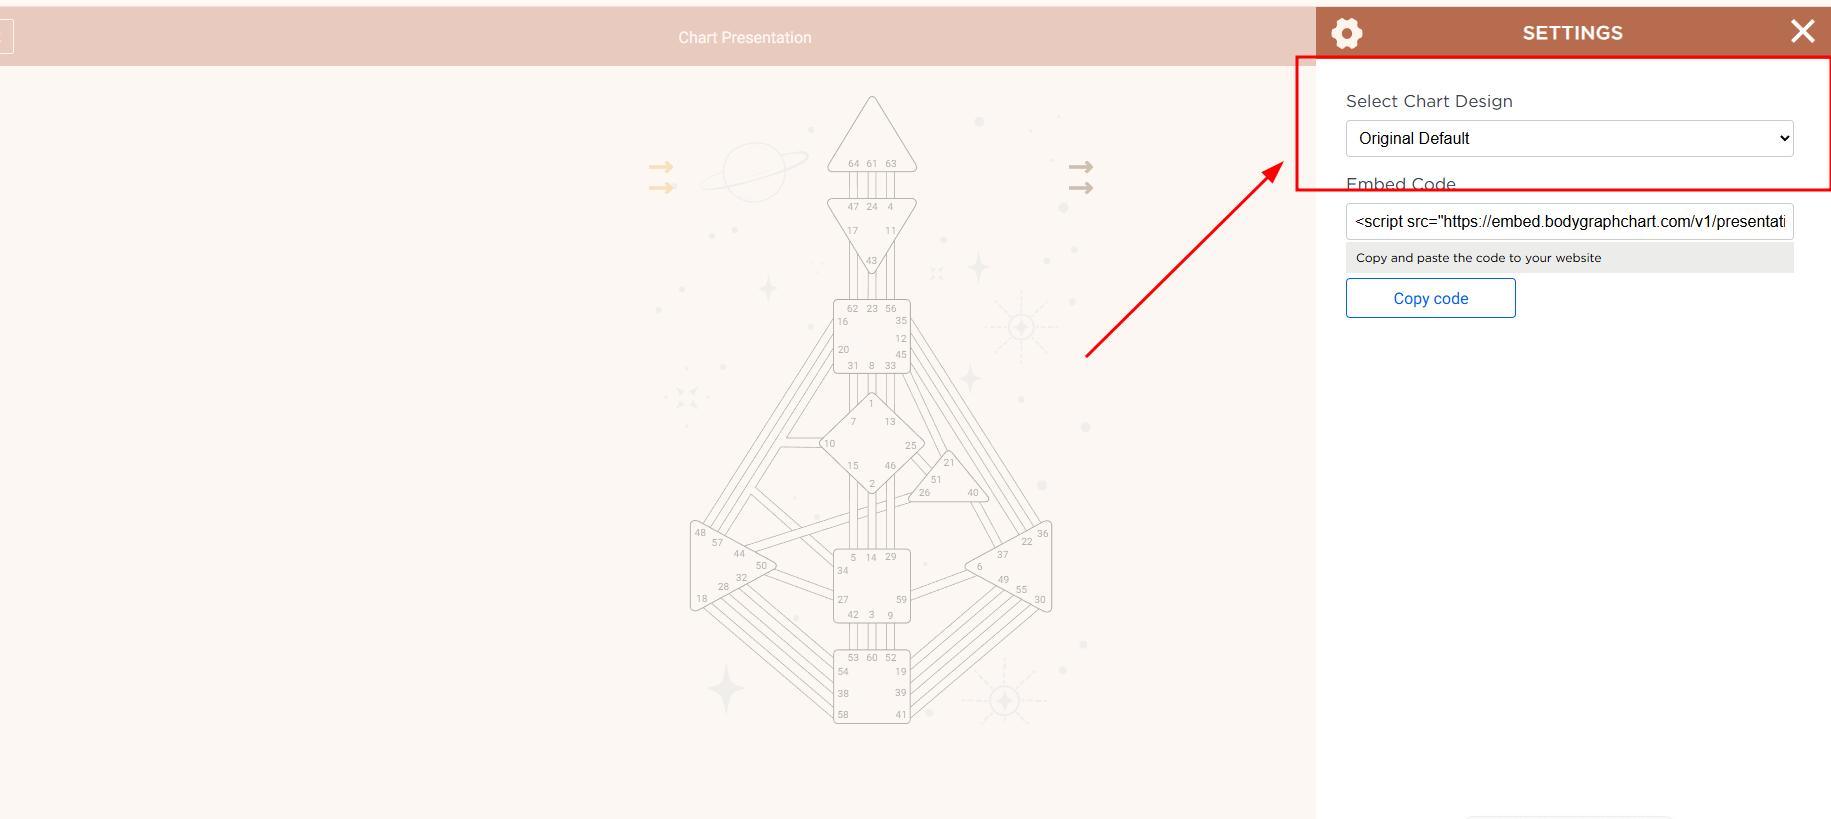
Chart Builder (previously Presentation Tool)
Common Mistakes to Avoid
1. Editing the wrong design
The most frequent mistake is making changes to a design that is not linked to the embed code. Always check:
• which embed codes are assigned to a design
• whether your changes apply to the design used on your website
Hovering over the status color shows which embed codes currently use that design.
2. Confusing the default label
The yellow default label does not mean your integration uses the design. It only means:
• it is the fallback design provided with your subscription
• it is used if the assigned design gets deleted
Your integration only uses the design explicitly assigned in your embed code settings.
3. Deleting a design that is currently in use
If a design is deleted:
• your embed code will revert to the default design
• report chart elements may continue working temporarily but become more prone to errors
• ideally, you should replace chart elements in all reports and reassign the proper design.
4. Using unsupported special characters in the design title
Avoid unnecessary special symbols like dollar signs or decorative characters. They can cause errors and prevent the design from appearing in reports.
5. Using extremely pale colors
Very light colors can cause usability issues:
• defined centers may look undefined
• clients may misinterpret chart accuracy
• readability drops on light backgrounds
Use pale colors only if they contrast well against the website background.
6. Expecting to upload custom backgrounds or import external SVGs
Neither is supported. Import is intended only for restoring exported designs made within the Bodygraph Chart Designs tool.
7. Using one design across multiple embed codes with different needs
If all embed codes use the same design, any change made to that design and settings applies everywhere.
If you need different behavior, duplicate the design and assign separately to dedicated embed codes.
Frequently Asked Questions
Can I use more than one design for my integration?
Yes. You can create unlimited designs, but one embed code can serve only one design at a time. Many users create seasonal designs – for example, Christmas or Valentine’s Day – and temporarily switch them on.
Do my reports need to use the same design as my integration?
No. You can mix and match designs freely. Reports can use completely different styles from your main chart integration.
Why do my changes apply to all integrations?
If multiple embed codes use the same design, any edits will affect all of them. If you need different behavior, duplicate the design before customizing it.
Can I upload my own chart background image?
No. Only the built-in backgrounds are supported.
Can I import my own chart SVG?
No. Import only restores designs exported from the design tool.
How do I change labels or agreement text?
The chart design tool controls layout, colors, and fonts.
Text labels – such as button labels, copyright text, or terms – are edited in the Content Tool, not the design tool.
Final Thoughts
You’ve now created your first chart design and understand how to adjust both visual and functional settings. Remember:
• you can always update your design later
• you can switch designs on your live integration at any time
• seasonal or event-themed designs are easy to set up
• consistency across integrations and reports is simple once you understand assignments.
With your foundational setup complete, you’re ready to move to the next step.
Also check video tutorial below:
Still have questions? Is above guide outdated? Please message us on Live Chat or send an email to support@bodygraph.com.
All the Tools You Need to Build, Grow, and Scale Your Human Design and Astrology Business
