


Track Your Chart Sales, Downloads & Performance in One Dashboard
See what’s working – and where to grow. The Statistics Dashboard gives you real-time insights into how your business is performing. From chart generation to report downloads and sales, all your key metrics are in one place, easy to understand and act on.
Start free trial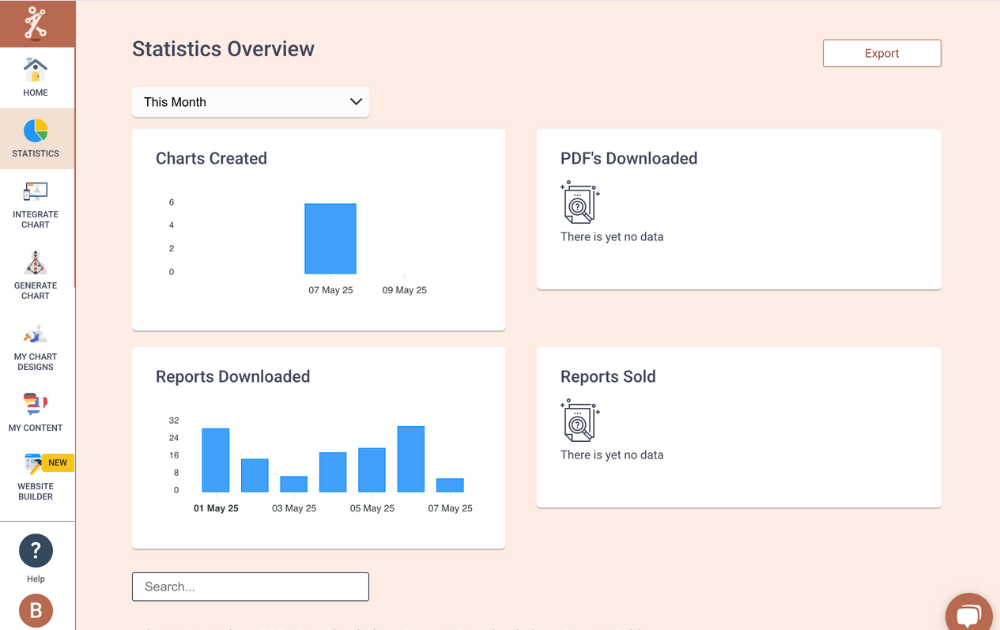
Track How Many Charts Are Generated on Your Website
See how many visitors are using your chart tools - from Human Design to Astrology and beyond. Understand what drives engagement and when your traffic spikes.
Start Free TrialMonitor Reading and Audio Report Downloads
Know exactly how many reports (PDF or audio) are being downloaded - and which types are most popular. This helps you create more of what your audience wants.
Start Free Trial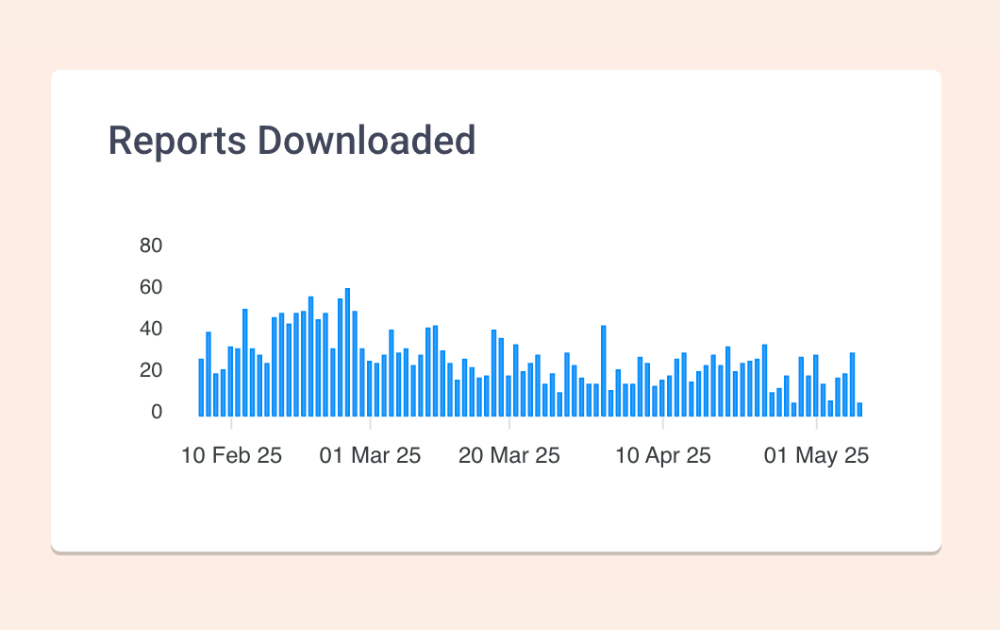
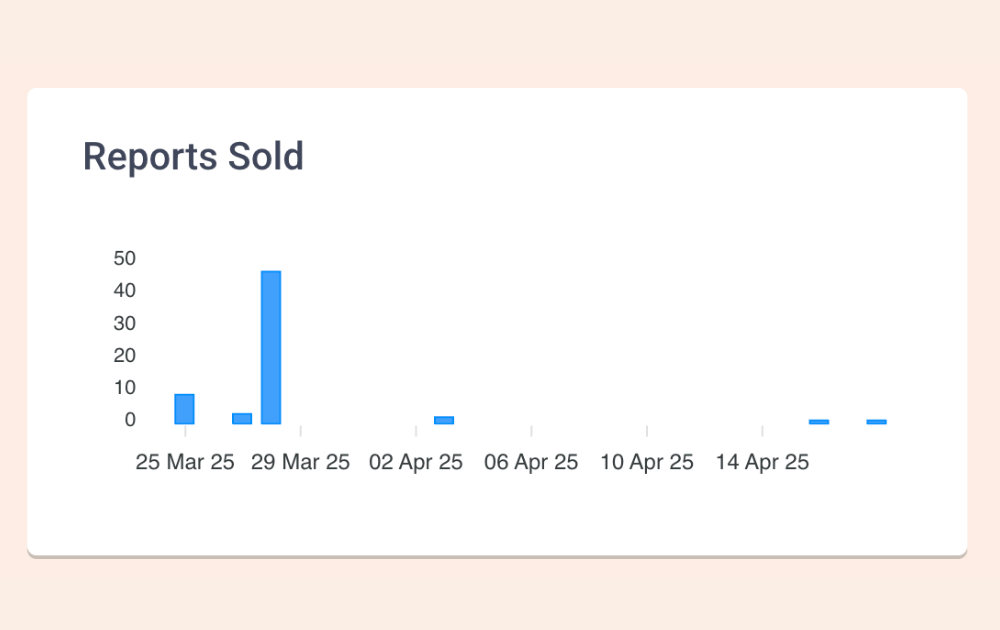
Follow Your Sales & Conversion Metrics
Track your revenue in real-time. See which products are selling, where buyers are coming from, and how your lead magnets or website pages are performing - all in one simple view.
Start Free TrialMore Bodygraph Success Stories

Nicoline Huizinga
My turnover has increased by 15% since I use Bodygraph.com - and it's only been 3 months.

Lee Maria Duffy
Using Bodygraph.com has completely transformed my approach to my Human Design business.

Kathy Bochonko
I love how customizable Bodygraph.com is. I can really make it reflect my brand.

Jennifer Birkhead
I love that everything is in one place and I can integrate it seamlessly into my own website.

Veronica Mezzetti
By integrating the Bodygraph.com on my website I have been able to drastically increase new leads.
Sheena Mason-White
Bodygraph.com saves time and frees me up to do more readings and therefore make more money.

Morgan Pappas
The wealth of courses and resources included in my subscription is truly remarkable.

Claudia Gomez
Bodygraph.com is easy and aesthetically pleasing. It is a great companion for your business.

Teresa Crifo
Since implementing the BGC report on my website I save at least one hour per client generating the PDF.

Jahje Ives
It's the best way to grow a human design business and sell reports for a passive income.

Vickie Dickson
Having the ability to run charts on my own website has been a game changer for my business.

Daniela Barletta
I Love BGC because I have so many options with it and can visually adapt it to my branding.
Frequently Asked Questions
Start free trialBodygraph.com Statistics is included in the Full Business Package – there’s no extra cost.
You don’t need to pay separately to access it. For full pricing details, please view our plans page.
Scale your Business
Build a business that grows with you - not one that drains your time. This category includes tools like the Website Builder, Integrations, and the Statistics Dashboard to help you automate, track, and optimize everything. From selling reports on your own site to syncing data across your favorite platforms, you’ll have everything you need to scale smoothly and sustainably.
More Features
