


What is Chart Design tool?
Last Updated: May 5, 2026
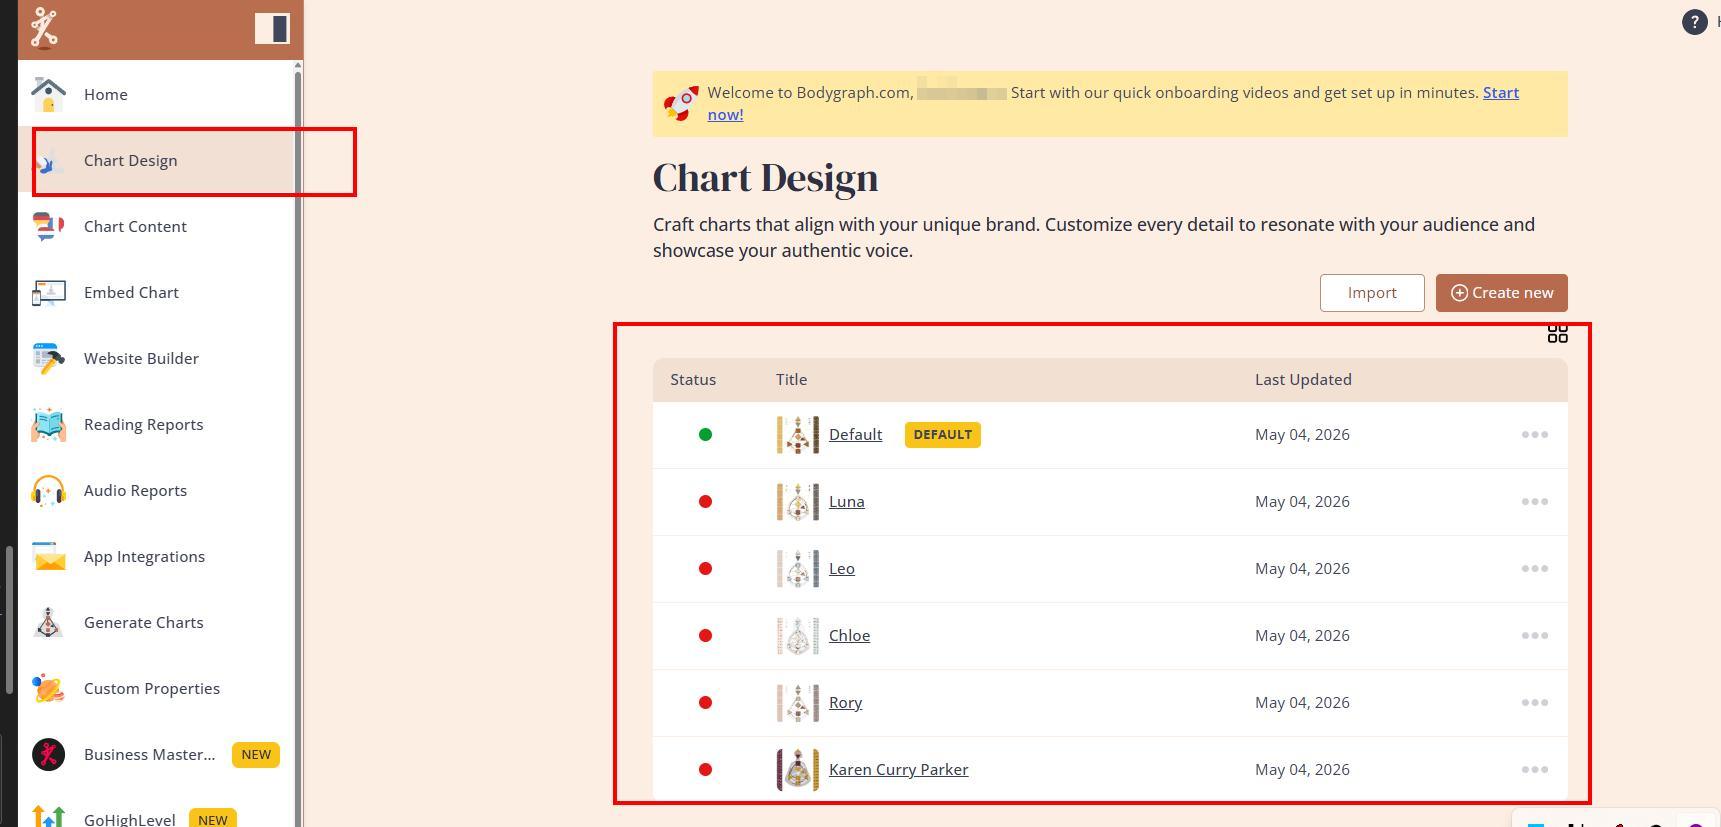
The Bodygraph chart design tool offers a flexible way to customize Human Design and astrology charts so they match your website style and brand identity. Once you start a subscription, you get access to several pre-made designs that can be used immediately in integrations and reports. A default design is automatically applied to your embed code, but you can change it at any time by editing it, selecting another existing design, or creating a new one.
Each design you create is used across multiple areas of the system. This includes website integrations via embed codes, the Generate Chart tool used internally to create charts, and reading reports exported as PDF. In reports, charts can be inserted as full elements or broken into parts and arranged freely on the page. However, report previews are only placeholders, as the final chart changes dynamically based on each client’s birth data.
Designs also appear in the Chart Builder tool, which is used for presentations, social media visuals, and group readings. Here, you can highlight chart elements and export them as images or PDFs. If needed, a specific design can be assigned so all generated visuals stay consistent across your projects.
The design tool allows you to adjust Human Design and Astrology hart colours, shapes, and background styles. It is important to keep calculation settings consistent. For example, Human Design typically uses the tropical system, and changing it can alter results significantly. In astrology, both the house system and zodiac system must match across all tools to avoid mismatched charts.
Additional settings control how charts behave in forms and reports. You can adjust date formats, agreement checkboxes, tooltips, property descriptions, and layout positions for report elements. Custom fonts are also supported, but they must first be uploaded in the correct formats before they become available in the design settings.
Overall, the chart design tool is built to ensure consistency across integrations, reports, and visual presentations, allowing to align the charts with your brand style.
Related Video:
Related Articles
Enable your design at chart integration
Still have questions, is above guide outdated? Please message us on Live Chat or send an email to support@bodygraph.com.
All the Tools You Need to Build, Grow, and Scale Your Human Design and Astrology Business
