Human Design Analytics & Performance Tracking

Understand exactly how visitors interact with your Human Design tools, charts, and reports. Track chart generations, lead captures, downloads, and report sales from a single dashboard. Whether you're a Human Design practitioner, coach, astrology business, or enterprise partner, Bodygraph Analytics helps you measure engagement, identify revenue opportunities, and make better business decisions.

Trusted by professional Human Design practitioners, coaches, and educators worldwide.

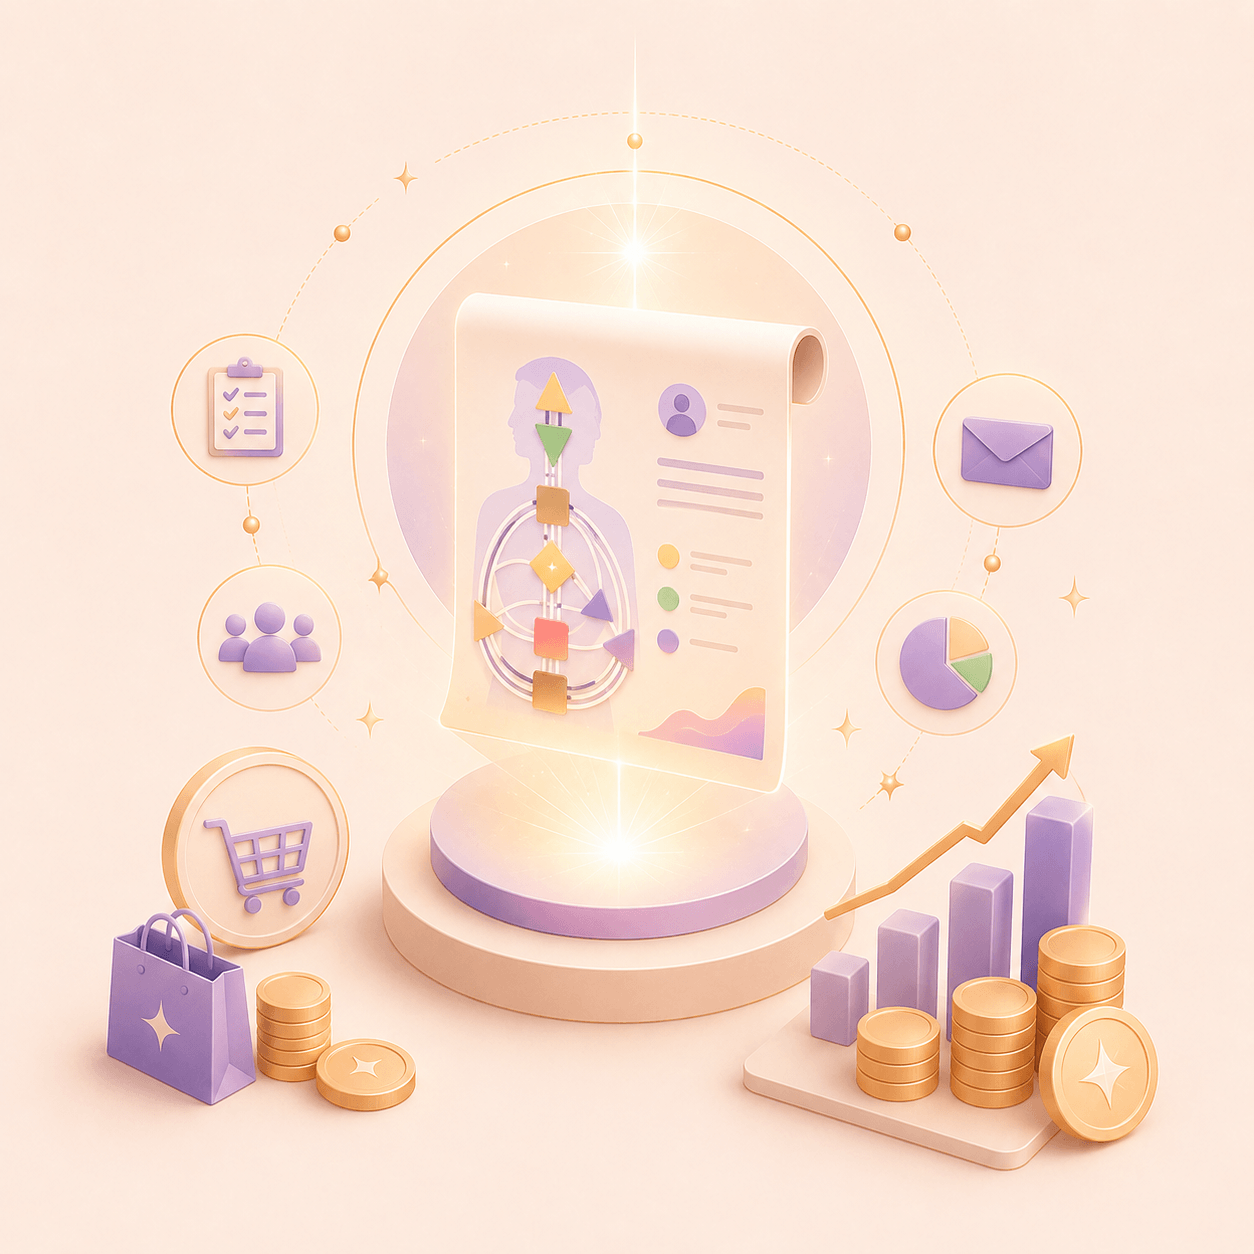
Bodygraph Analytics dashboard preview

What is Analytics and Performance Tracking?

Analytics and Performance Tracking gives you complete visibility into how your Human Design tools perform across your website. See how many charts are generated, how many visitors become leads, which reports generate revenue, and how your audience engages with your embedded experiences.

Analytics dashboard
Analytics performance data

Measure What Matters, Grow With Confidence

Instead of guessing what works, you can measure chart activity, lead generation, downloads, and report purchases across every embedded chart experience. This allows practitioners and businesses to optimize conversions, improve client journeys, and grow revenue with confidence.

How it Works

Every chart experience, lead magnet, and report on your website generates valuable business data. Bodygraph Analytics collects this information and presents it in a simple dashboard so you can understand visitor behavior, track conversions, and identify growth opportunities.

Chart Generation Tracking

See exactly how many visitors generate Human Design charts through each embedded chart experience on your website. Compare performance across multiple chart tools and identify which placements attract the most engagement.

Purpose: Measure audience interest and chart activity across your website.

Lead Capture Analytics

Track how many visitors submit their contact information when generating charts. Monitor email captures and optional phone number collection to understand lead generation performance.

Purpose: Measure lead growth and conversion rates.

Lead Magnet Downloads

See how many users download free reports, guides, and lead magnets connected to your chart experiences. Understand which resources generate the highest engagement and subscriber growth.

Purpose: Identify your best-performing lead generation assets.

Report Sales Tracking

Monitor purchases of PDF reading reports and audio reports directly from your analytics dashboard. Understand which report offers generate the most revenue and customer interest.

Purpose: Track report sales and revenue performance.

Conversion Performance Dashboard

Analyze visitor journeys from chart generation through lead capture, download, and purchase. Discover where users engage and where opportunities for improvement exist.

Purpose: Improve conversion rates across your business.

Multi-Embed Performance Comparison

Compare analytics across multiple chart embeds, lead magnets, and website placements. Quickly identify which tools produce the strongest results.

Purpose: Optimize website performance and marketing decisions.

Why Use Human Design Business Analytics?

Successful Human Design businesses rely on data, not assumptions. Analytics helps you understand how visitors interact with your chart tools, where leads come from, and which products generate revenue.

Understand Visitor Behaviour

See how people use your chart tools and identify which experiences create the highest engagement.

Generate More Qualified Leads

Track email and phone captures to understand which chart experiences attract your most valuable prospects.

Increase Report Revenue

Identify your highest-converting reports and focus on the offers that generate the most sales.

Make Better Business Decisions

Use real performance data to improve marketing campaigns, website placement, lead magnets, and sales funnels.

Frequently Asked Questions

What is Human Design business analytics?

Human Design business analytics helps practitioners track chart generations, lead captures, downloads, and report sales so they can better understand audience engagement and business performance.

Can I track chart generations on my website?

Yes. Bodygraph Analytics tracks chart generations across all embedded chart experiences, allowing you to measure engagement and compare performance between different placements.

Can I see how many leads my charts generate?

Yes. You can monitor email captures and optional phone number submissions to understand how effectively your chart tools generate new leads.

Can I track lead magnet downloads?

Yes. Analytics shows how many visitors download free resources, reports, and lead magnets associated with your chart experiences.

Can I track sales of PDF and audio reports?

Yes. The dashboard includes report sales tracking for both PDF reading reports and audio reading reports, helping you understand revenue performance.

Can I compare multiple embedded charts?

Yes. If you use multiple chart embeds on your website, you can compare their performance and identify which experiences generate the most engagement, leads, and sales.

Who is Analytics and Performance Tracking designed for?

The platform is designed for Human Design practitioners, coaches, educators, astrology businesses, agencies, and enterprise organizations that want to measure growth and improve conversion performance.

Start Tracking Your Human Design Business Performance